Our Products > Air quality analytics Dashboard
Access and visualise air quality data in African Cities.
If we can’t measure air pollution, we can’t manage it: Access, track, analyse and download insightful air quality data across major cities in Africa.

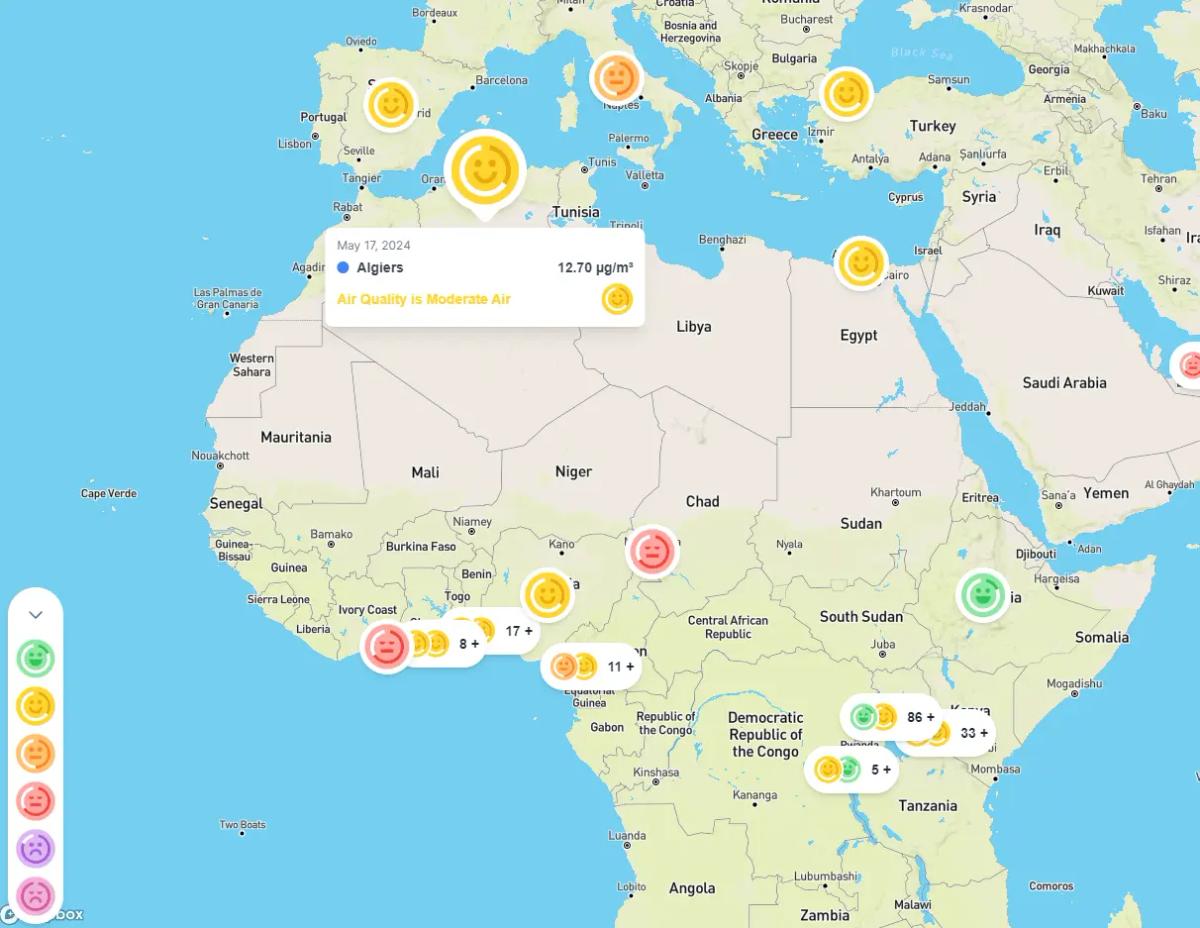
Real-time air quality analytics for African Cities
Air pollution in many cities in Africa is under-monitored in part due to the logistical constraints of setting up and maintaining a monitoring network, coupled with the expertise to process and analyse data.
Timely access to data
The air quality analytics dashboard is an intuitive software dashboard that allows you to have timely access to historic, real-time, and forecast actionable air quality information across our monitored urban spaces in Africa.
We want to see citizens and decision-makers in African Cities have timely access to air quality trends, patterns, and insights to inform data-driven decisions to tackle air pollution.


Gain insights to take action
We integrate AI and machine learning models to deliver predictive insights, giving stakeholders access to historical, real-time, or forecast air quality data in locations that matter to them. This empowers the stakeholders to make evidence-informed decisions to better manage air pollution.
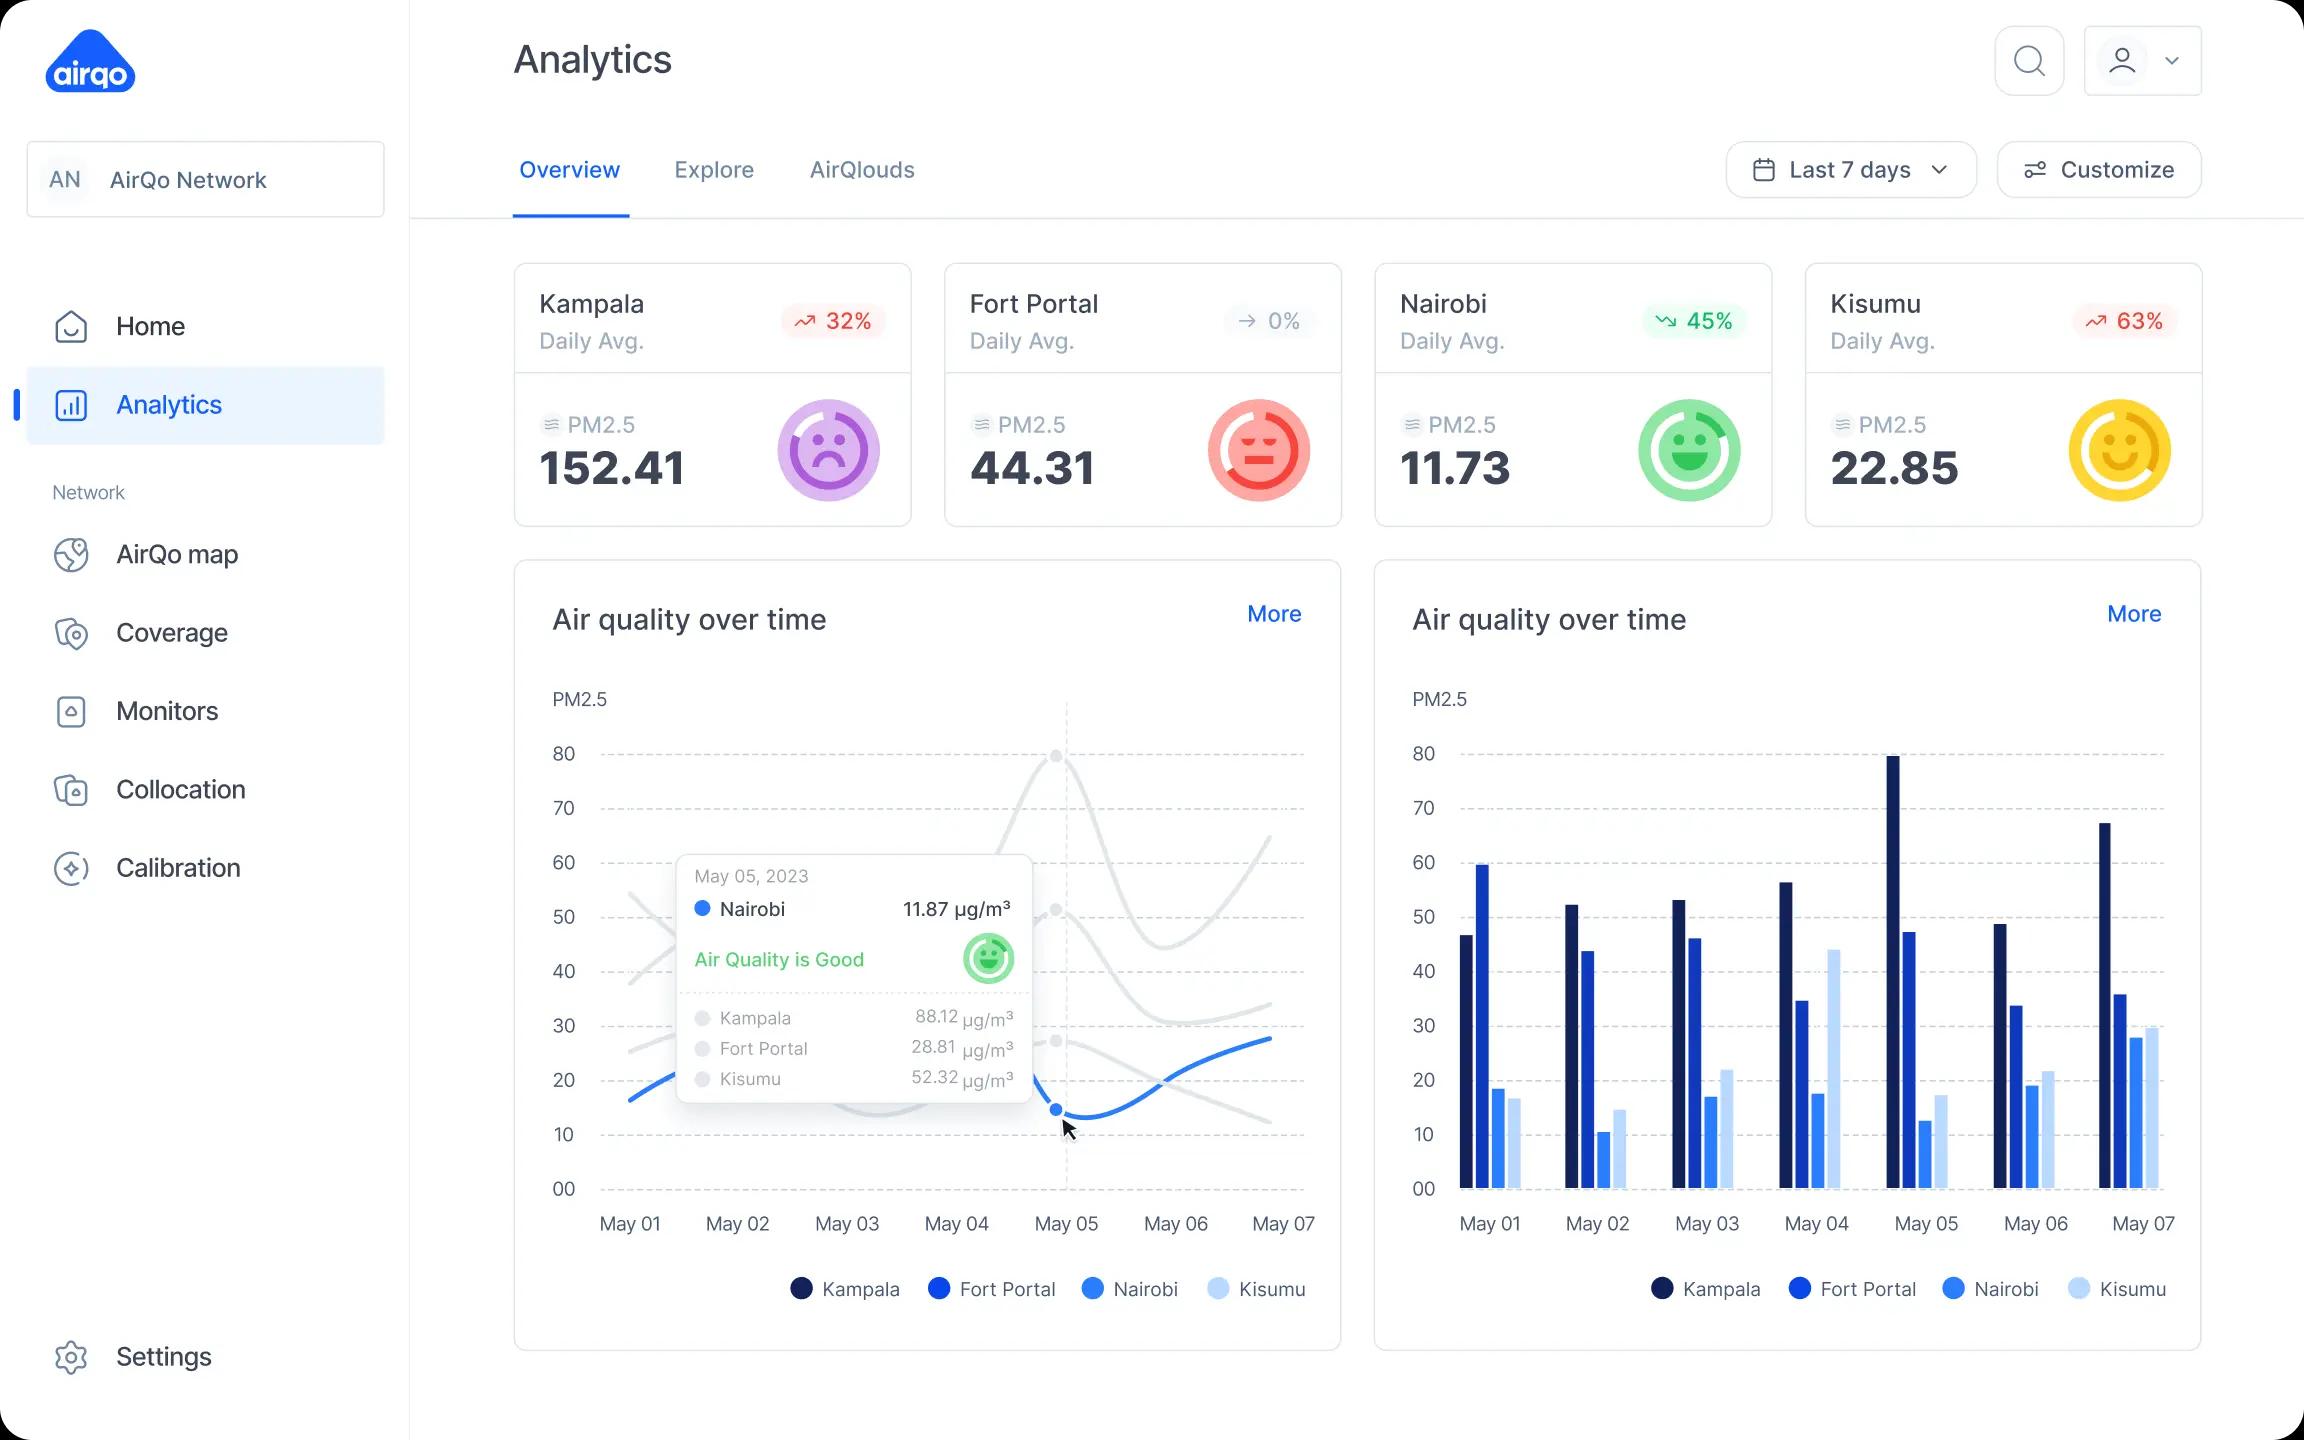
Easily generate, download and compare air quality data across various African cities and develop evidence-informed actions for air pollution.
Easy to use interface
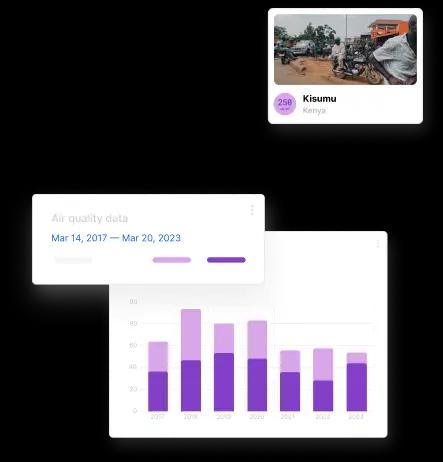
Our visualization charts are designed to help you easily interpret and gain insights into the data while giving you access to air quality trends in African Cities over time. With our easy-to-use interface, you can track and visualise air quality trends over time.


Google.org Leaders to Watch 2022
From expanding equity in education to addressing environmental issues, this year's Leaders to Watch are building a better future for everyone.
Learn more →